Monitor SLA adherence, response times, workload, and agent performance in real-time. Make data-driven decisions to improve support efficiency.

Overview

If you’re managing a B2B team on WhatsApp, it’s not always easy to tell- are your agents meeting SLAs and responding on time, or are customers waiting longer than they should? With Periskope’s Analytics Dashboard, you can track your team’s performance, workload, and SLA adherence all in one place. Stop guessing. Start measuring.

How It Works

The Analytics Dashboard gives you visibility into three key areas of team performance:
  • Team Analytics - Agent workload and SLA compliance
  • Chat Metrics - Incoming demand and conversation patterns
  • Message Metrics - Response times and communication activity
Together, these dashboards help you understand how your team is performing, identify bottlenecks, and take action to improve customer satisfaction.

Accessing the Analytics Dashboard

From your Periskope dashboard, go to Analytics. You’ll see multiple tabs at the top: Team Analytics, Chat Metrics, and Message Metrics. Each tab provides different insights into your operations.

Team Analytics

Team Analytics gives you an overview of how your entire team is performing. This is your go-to view for spotting workload imbalances and tracking key performance indicators.
Image
  1. Active Chats Per Agent
See how many active chats each agent is handling right now. This helps you quickly identify if someone is overloaded or underutilized. If one agent has 15 chats and another has 3, you know it’s time to rebalance.
  1. Chats Initiated
Track the total number of conversations started during your selected period. This shows the volume of new customer interactions your team is dealing with.
  1. Tickets Closed
Monitor how many tickets your team has resolved. High numbers show productivity. Compare this to chats initiated to see if your team is keeping up with demand.
  1. Flagged Messages
See how many messages have been flagged for attention. High numbers might indicate complex issues or messages that need escalation. Review flagged items regularly.
  1. Average Response Time
This is critical for SLA compliance. Track the average time it takes your team to respond to messages. If response times are increasing, it’s a sign to investigate bottlenecks or add resources.
  1. Date Range Adjustment
You can adjust the date range to analyze performance over different periods. View the last few hours for real-time monitoring, last 7 days for weekly trends, or set a custom range for deeper analysis.

Chat Metrics

Chat Metrics helps you understand the incoming demand on your team. This tells you how your business is growing and whether you need to scale your team.
Image
  1. New Chats Over Time
Track the volume of new conversations starting each day or hour. The graph visualizes trends, making it easy to spot spikes. A sudden spike might indicate a successful campaign, a product issue, or seasonal demand.
  1. One-on-One vs Group Conversations
See the split between individual customer chats and group conversations. This helps you understand customer behavior. If most conversations are 1-on-1, your team is likely handling individual issues. If many are group chats, you might be coordinating larger deals.
  1. Chat Metrics Overview Graph
The graph visualizes all this data over time. Look for patterns. For example, if new chats spike every Monday, you might need extra staffing on weekends. If they decline, you have more capacity.

Message Metrics

Message Metrics shows how your team is communicating day-to-day. This is where you track response times and identify communication bottlenecks.
Image
  1. Incoming vs Outgoing Messages
Compare the volume of incoming customer messages to outgoing team responses. If incoming messages are climbing faster than outgoing messages, your team is falling behind. This is an early warning sign.
  1. Active Chats
Track how many conversations are currently active. This helps you see real-time engagement levels and capacity utilization.
  1. Flagged Messages
Monitor messages that need attention. These might be urgent requests, issues that need escalation, or conversations that have gone silent.
  1. Median Response Time - Team Level
See the overall response time for your entire team. This is your key SLA metric. If it’s trending upward, you need to investigate why conversations are taking longer.
  1. Median Response Time - Individual Level
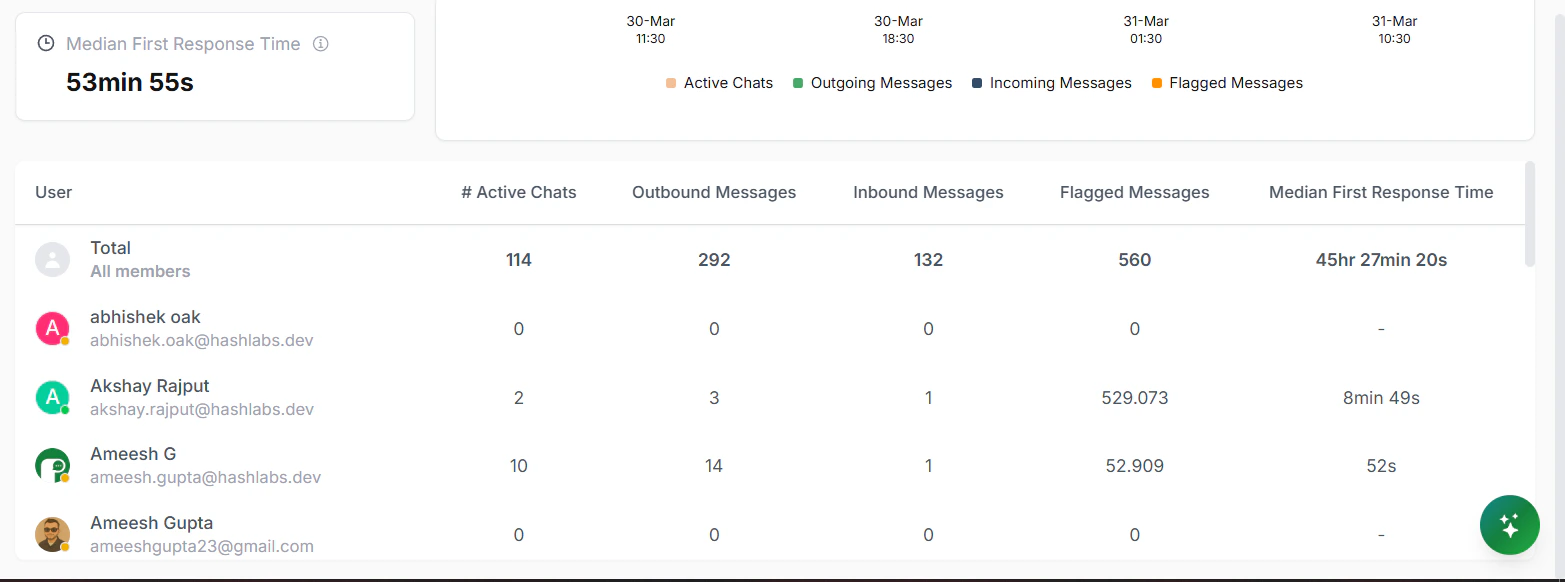
Drill down to see response times for each agent. This helps you identify bottlenecks. If one agent’s response time is much higher than others, there might be a workload issue or a need for additional training.
Image
  1. Message Metrics Overview Graph
The graph visualizes messaging patterns and response times over your selected period. Look for trends. Are response times getting faster or slower? Is message volume increasing?